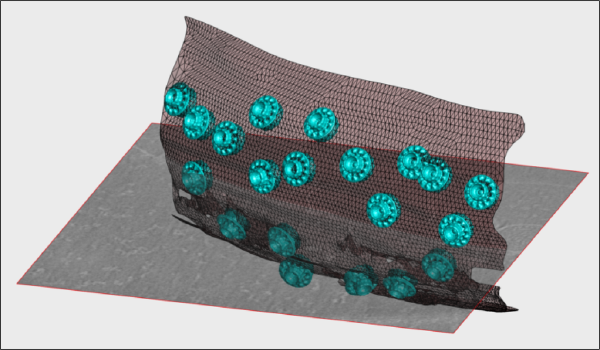
Walkthrough on creation of 3d scenes
This walkthrough shows how to create graphic depictions of tomogram contents. Those include:
- Slices of tomgrams
- Objects loca
- Geometrical objects (as membranes represented by triangulations)
The data set
This walkthrough works with the data set from the advanced starters guide. The goal is to depict:
- One slice of the tomogram in 3D.
This requires a tomogram file.
- The viruses placed an oriented along the directions found during a previous computed average.
This requires a template represe.
- A sketch of the membrane
This requires a model object.
In
From the Dynamo web
The tomogram can get fetched through:
Then we just
From your previos work
Assuming you have done the tutorial on the FHV data set, you can use the elements that you have already computed. Just extract them from the best project that you completed. Do not use a subboxing project: we want to get a template for the full crown,
Table
>> ddb localizedFullAngle:rt -r t
>> ddb localizedFullAngle:rt -r t >> dwrite(t,'averagedLocalRefinement.tbl'); >> ddb localizedFullAngle:rt -r a >> dwrite(a,'averagedLocalRefinement.em'); >> dwrite(t,'alignmentLocalRefinement.tbl') >> dwrite(t,'averagedLocalRefinement.tbl'); >> ddb localizedFullAngle:rt -r a >> dwrite(a,'averagedLocalRefinement.em'); >> dwrite(t,'alignmentLocalRefinement.tbl')
