Construction of masks
Dynamo uses several types of masks in different pipelines.
Masks are used in Dynamo for several purposes: indicating the active part of the template for alignment, restricting the area of the aligned particles that will count for classification, avoiding FSC artifacts, placing aligned averages back in a tomogram....
In some tasks, the masks are expected to be simple geometrical shapes. In other occasions, it might be necessary to have a finer control on the process of constructing a mask. Dynamo includes several tools:
Contents
Geometrical Shapes
Use dmask to open a GUI with several geometrical options: spheres, ellipsoids, tubes, cylinders. dmask can be used from the command line.
There are other commands for specific geometries: dsphere, dshell, dcylinder....
Freehand draw
You can edit a template and draw on its 2D slices handdraw lines each enclosing an area of interest. There a different ways to convert such an area into a 3d volume
Revolution solids
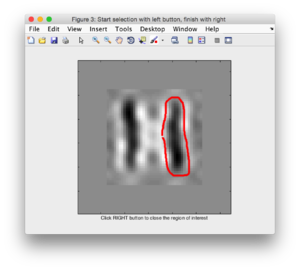
Here, you would enclose an area on a 2d slice that includes the Z axis (i.e., a section from an X-view or a Z-view), and then let Dynamo rotate the area around the central Z axis to create a revolution solid.
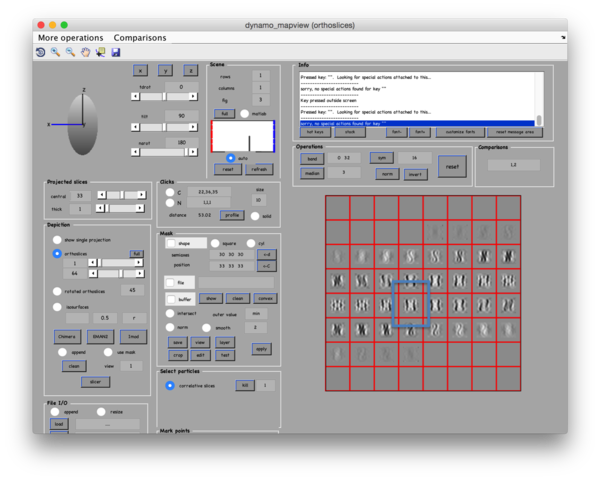
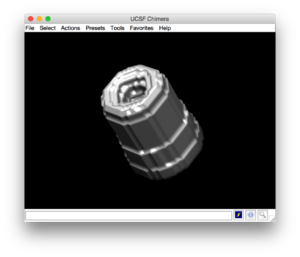
This can be done with dynamo_mapview. Open your template, go to an X view, select one slice and press on [shift+S]. A second window will pop up, zooming into the selected slice. When you finish, the message area will tell you the name of the file containing the the created revolution solid, by default temp_drawn_revolution_mask.em. You can secondary click on it to directly show in Chimera.
Slide by slide
You can edit a volume as a montage of orthoslices, and handdraw on each of them, or onto a selection of them an let Dynamo interpolate on the other sections. This interpolation is purely geometrical and doesn't take the graymap into account.
You can test the procedure with the shipped phantom template.
dpkvol.montage('template.em');
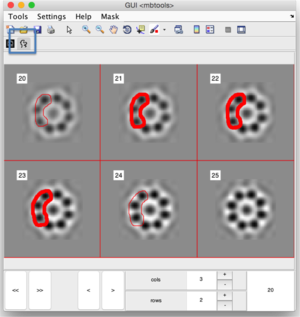
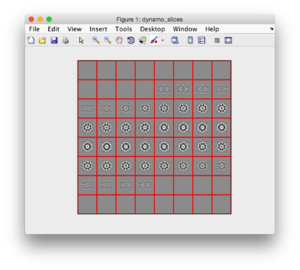
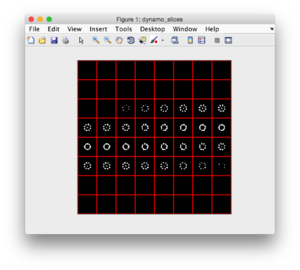
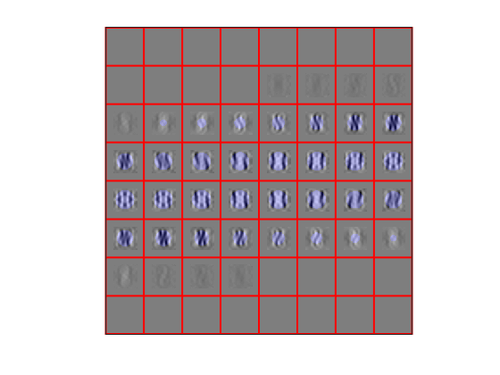
Then choose the Mask tab to created a control for free handdraw of shapes on each slice. It will appear as a small icon on the toolbar (see figure below). Secondary click on a drawn level will offer a menu of options, like interpolating between user-marked levels, or converting the current set of lines into a file.
The example below shows the process of constructing a mask tight on just three subunits a barrel-shaped protein. The "staves" will slightly twist, so that one shouldn't set a large space between the sections were the user actually draws points, otherwise the interpolation will fail.
By thresholding and smoothing
A mask can be defined by thresholding the intensity of a given template.
Assuming a template where protein is dark on a bright background:
Creates a variable in the workspace that contains the template
template = dread('template.em'); % reads the file
Create an all black cube:
mask = zeros(size(template));
puts ones (mask is bright) on the pixels where the template has lowest values, in this case below a predefined template:
threshold = -0.003; mask(find(template<threshold))=1;
This procedure frequently needs some auxiliary steps like:
- visualizing the density map of the template to select an appropriate threshold
- using bandpass/median filters before the thresholding operation
- using dilation operations on the created mask
- intersecting the density-based map with a wider geometrical mask.
Combination of masks
It is easy to create combinations of masks using logical operators: or just "adds" masks.
Alternatively, you can use the compact syntax in dynamo_mask_combine on a cell array of masks defined independently.
  % adds two different masks
a{1} = dynamo_sphere(20,128,[64,64,40]);
a{2} = dynamo_sphere(20,128,[64,64,80]);
finalMask = dynamo_mask_combine(a);
dview(finalMask)
The flag delete can be used to define parts of the final mask that need to be set to zero (black).
 % deletion
a = dynamo_sphere(60,128);
b = dynamo_sphere(20,128);
% deletes mask b from mask a
finalMaskWithoutCenter = dynamo_mask_combine(a,'delete',b);
dview(finalMaskWithoutCenter)
Depicting mask overlays
When you design a mask, it is frequently useful to check how it relates to a given template. This can be done with the command dslices, using the flags overlay, overlay_as
For instance, if you have a template template.em and want to see how a sphere of radius=16 would act on it, you can type:
dwrite(dynamo_sphere(16,64),'mask.em');
dslices template.em y -ov mask.em -ovas mask -ovc b
ov or overlay is the overlaying volume (in this case the just created file mask.em), ovas or overlay_as indicates that the overlaying volume is to be understood as a solid mask (i.e., we are interested in showing the bright pixels in the mask as a solid color). You can choose color and transparency with ovc/overlay_color and alpha.
