Difference between revisions of "Dtmslice"
| (20 intermediate revisions by the same user not shown) | |||
| Line 1: | Line 1: | ||
<tt>dtmslice</tt> or <tt>dynamo_tomoslice</tt> is the current main tomogram browser inside ''Dynamo''. | <tt>dtmslice</tt> or <tt>dynamo_tomoslice</tt> is the current main tomogram browser inside ''Dynamo''. | ||
| − | [[File:ExampleTomoslice.png|thumb|right| | + | [[File:ExampleTomoslice.png|thumb|right|400px| A screenshot on <tt>dtmslice</tt> ]] |
The main axis in the figure will show a slice across a volume. The volume is kept in memory. In general, volumes with ''effective'' dimensions of 1000k x 1000k x 400 voxels are depicted efficiently by the Matlab renderer, i.e., you can move the depicted slice across the volume reasonably fast. Here ''effective'' means that we are are referring to the volume actually stored as a matrix in the memory of the browser. Thus, if you want to visualize a tomogram file with a dimension of 4k x 4k x 1k pixels you probably want to visualize it trough a binned proxy. | The main axis in the figure will show a slice across a volume. The volume is kept in memory. In general, volumes with ''effective'' dimensions of 1000k x 1000k x 400 voxels are depicted efficiently by the Matlab renderer, i.e., you can move the depicted slice across the volume reasonably fast. Here ''effective'' means that we are are referring to the volume actually stored as a matrix in the memory of the browser. Thus, if you want to visualize a tomogram file with a dimension of 4k x 4k x 1k pixels you probably want to visualize it trough a binned proxy. | ||
| Line 34: | Line 34: | ||
== Viewing controls == | == Viewing controls == | ||
| − | + | === Scene perspective === | |
| − | + | Zoom, rotation and dragging are available through keyboard strokes,[[3d mouse | mouse actions]] or icons in the toolbar. For keyboard and mouse, the activation a viewing control requires that the scene is in scope, i.e., the <tt>dtmslice</tt> figure must be selected. A secondary click on the depicted slice ensures that the tomogram scene is selected, and thus that that subsequent keys will indeed activate a viewing option. | |
| + | ====Zoom action ==== | ||
| + | |||
| + | *With the mouse | ||
| + | |||
| + | You can zoom in an out by keeping the control key pressed while using the mouse wheel. | ||
| + | |||
| + | *With the keyboard | ||
Invoked through the press of <tt>[-]</tt> or <tt>[+] </tt>. The tomogram scene must be selected. | Invoked through the press of <tt>[-]</tt> or <tt>[+] </tt>. The tomogram scene must be selected. | ||
Should turn the arrow cursor into a cross cursor. When the magnifying icons in the toolbar are active, you can use the mouse wheel to zoom in and out of the scene. | Should turn the arrow cursor into a cross cursor. When the magnifying icons in the toolbar are active, you can use the mouse wheel to zoom in and out of the scene. | ||
| Line 43: | Line 50: | ||
The zooming state can be interrupted by pressing <tt>[space]</tt> or invoking any other viewing control (through <tt>[r]</tt> or <tt>[p]</tt>). | The zooming state can be interrupted by pressing <tt>[space]</tt> or invoking any other viewing control (through <tt>[r]</tt> or <tt>[p]</tt>). | ||
| − | === Rotation of viewing angle === | + | ==== Rotation of viewing angle ==== |
| + | *With the mouse | ||
| + | Main click on the scene (but not on an object) while keeping the control key pressed. You can rotate the point of view by moving the mouse till you release the button. | ||
| + | *With the keyboard | ||
| + | Invoked through pressing <tt>[r]</tt>. The cursor should turn into a circling arrow. In this state, moving the mouse while keeping the main button pressed will change the point of view of the scene. | ||
| + | |||
| + | This state can be interrupted by pressing [space] or invoking any other viewing control, through <tt>[-] </tt>, <tt>[+] </tt> or <tt>[p]</tt>. | ||
| + | |||
| + | ==== Pan action / Shift ==== | ||
| + | The pan action drags the scene by pinning a point with the cursor and shifting it. | ||
| + | |||
| + | *With the mouse | ||
| + | Main click on the scene (but not on an object) while keeping the <tt>shift</tt> key pressed. You can drag the full viewing scene by moving the mouse till you release the mouse button. | ||
| + | |||
| + | *With the keyboard | ||
| + | [p] activates the ''panning'' tool. When active, the cursor arrow appears as a hand symbol. | ||
| + | |||
| + | |||
| + | [[File:TomosliceToolbar.png|thumb|center|700px| Toolbar options in dtmslice]] | ||
| + | |||
| + | === Boxes === | ||
| + | |||
| + | You can create boxes in the scene with the box tool in the toolbar or simply by clicking on {{t|[v]}}. The boxes in the scene define regions that can be used for different tasks, most commonly: | ||
| + | * to redefine the axis limits (i.e., the part of the scene that is shown), | ||
| + | * to generate projection of variable size. | ||
| + | |||
| + | [[File:DtmsliceBoxCreated.png|thumb|center|700px| Creation of a box. Clicking on the lines allows to stretch the box]] | ||
| + | |||
| + | ==== Change of limits ==== | ||
| + | Secondary click on a box triggers a menu of options. With the first ones you can change the axis to the extent of the box in ''x'' and ''y'' (for the full z or just for the ''z'' extent of the box). | ||
| + | Note that this is just a change of axis viewing, and the main slice will be defined for the full tomogram. | ||
| + | |||
| + | [[File:DpksliceBoxZoom.png|thumb|center|700px| Redefining the scene limits through a box.]] | ||
| − | + | To regain the full view on the scene, you can click on the full axis icon in the toolbar, or secondary click on the box to get the option for full scene view. | |
| + | |||
| + | [[File:DtmsliceBoxResetLimits.png|thumb|center|400px| Resetting original limits through secondary click menu in the box.]] | ||
| + | |||
| + | ==== Projection tool ==== | ||
| + | |||
| + | The projection tool opens a new window representing the projection along ''z'' of the fraction of tomogram currently contained in the box. This projection will refresh automatically when you move the box. | ||
| − | + | [[File:DtmsliceBoxProjection.png|thumb|center|700px| Live projection tool]] | |
| − | === | + | === Oblique views === |
| − | [ | + | The main tool for visualizing and annotating on oblique slices are the [[Oblique slices in tomoslice | interactive rotation frames]]. They create a frame with a system of coordinates that can be dragged and rotated with the mouse, showing the cut slice as an auxiliary image that is also interactive, allowing the creation of models or the navegation in the tomogram. |
| + | [[File:SlicerObliqueView.png|thumb|center|700px| Rotation frames for visualization and annotations of oblique slices]] | ||
== Models == | == Models == | ||
| Line 90: | Line 136: | ||
==== Deleting points ==== | ==== Deleting points ==== | ||
The key [delete] will delete the last point inside a model (it can be used repeatedly to delete all points in the model in reversed creation order). To delete other points, secondary click on it and use the <tt>delete point</tt> option in the menu. | The key [delete] will delete the last point inside a model (it can be used repeatedly to delete all points in the model in reversed creation order). To delete other points, secondary click on it and use the <tt>delete point</tt> option in the menu. | ||
| + | |||
| + | == Custom plots == | ||
| + | |||
| + | One can use the scene in <tt>tomoslice</tt> to display any object from the command line. Matlab and ''Dynamo'' plotting commands can be directed to any graphic container, as long as one has a ''handle'' to the container. | ||
| + | |||
| + | The handle to <tt>tomoslice</tt> can be read simply by: | ||
| + | |||
| + | <tt>h = dpkslicer.getAxes();</tt> | ||
| + | |||
| + | Once <tt>h</tt> is defined, you can plot on it with any regular command. For instance, the Matlab {{t|plot3}} command: | ||
| + | |||
| + | <tt>plot3(x,y,z,'o','Parent',h);</tt> | ||
| + | |||
| + | assuming {{t|x}}, {{t|y}} and {{t|z}} are vector variables with the same number of entries. | ||
| + | |||
| + | ===Models=== | ||
| + | Models have native methods for depicting different representations: <tt>plotPoints, plotBoxes, plotDipoles, plotMesh </tt>. The syntax in all of them requires as first argument the handles to the graphic axis. | ||
| + | |||
| + | Thus, if you want to plot inside the current <tt>dtmslice</tt> session the surface of a vesicle, you just need to create the vesicle: | ||
| + | |||
| + | <nowiki> | ||
| + | v = dmodels.vesicle(); | ||
| + | v.radius = 30; | ||
| + | v.center = [400,200,120]; | ||
| + | </nowiki> | ||
| + | and then direct the <tt>plotSurface</tt> method to the handle <tt>h</tt> of the graphic scene of tomoslice: | ||
| + | |||
| + | <tt> v.plotSurface(h); </tt> | ||
| + | |||
| + | However, bear in mind, that the graphic entity that you depicted is treated merely as a graphic object: even if it stems from a model, its presence in the scene has not effect in the model pool. | ||
Latest revision as of 14:59, 27 November 2020
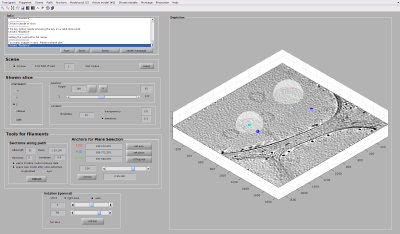
dtmslice or dynamo_tomoslice is the current main tomogram browser inside Dynamo.
The main axis in the figure will show a slice across a volume. The volume is kept in memory. In general, volumes with effective dimensions of 1000k x 1000k x 400 voxels are depicted efficiently by the Matlab renderer, i.e., you can move the depicted slice across the volume reasonably fast. Here effective means that we are are referring to the volume actually stored as a matrix in the memory of the browser. Thus, if you want to visualize a tomogram file with a dimension of 4k x 4k x 1k pixels you probably want to visualize it trough a binned proxy.
Links with a catalogue
When dtmslice has been invoked through a catalogue command, the dtmslice session is linked to this catalogue, and to a particular volume inside the catalogue. This means that the models that are imported, edited and/or saved will be automatically submitted to the folder in the catalogue that is linked to the tomogram currently depicted by tomoslice.
Opening dtmslice
Through the catalogue GUI
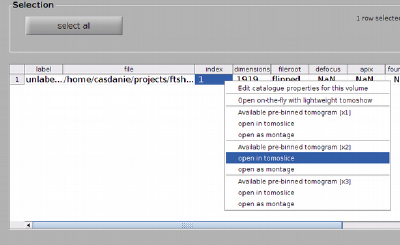
In principle, you can just select the row corresponding to your file and then open it with the Selected Volume > Open full volume with tomoslice menu options. For bigger volumes we strongly recommend to first create binned versions. They can then be opened with a secondary click on the row of the tomogram file:
Through the command line
Tomograms can be directly opened with the dtmslice order. When doing so, you should order the opening of prebinned versions.
Thus, while the command
dtmslice tomogram.mrc
is perfectly valid, the attempt of loading a full tomogram into dtmslice can crash it. We recommend using:
dtmslice tomogram.mrc -pb 2
which will open a prebinned version if available. Otherwise it will create it.
Catalogue links when invoked through the command line
When opening a tomogram through the command line, if you just pass the name of the tomogram file Dynamo does not know in which catalogue you want to operate. Thus, it will put the annotations on the file in a default catalogue. If you already know which catalogue you want to work with, you pass it with the 'c' flag:
dtmslice tomogram.mrc -pb 2 -c myCatalogue
Viewing controls
Scene perspective
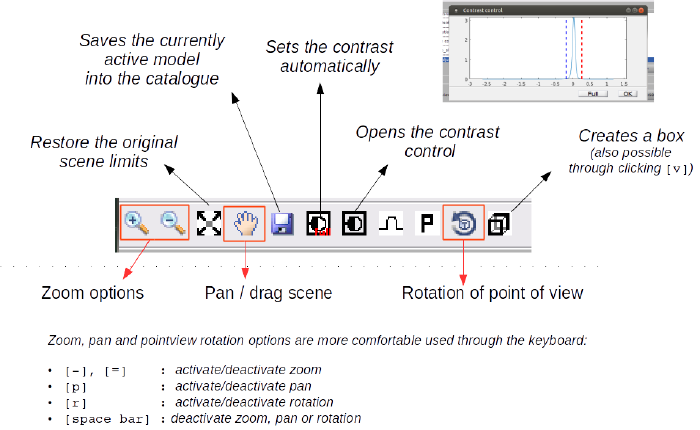
Zoom, rotation and dragging are available through keyboard strokes, mouse actions or icons in the toolbar. For keyboard and mouse, the activation a viewing control requires that the scene is in scope, i.e., the dtmslice figure must be selected. A secondary click on the depicted slice ensures that the tomogram scene is selected, and thus that that subsequent keys will indeed activate a viewing option.
Zoom action
- With the mouse
You can zoom in an out by keeping the control key pressed while using the mouse wheel.
- With the keyboard
Invoked through the press of [-] or [+] . The tomogram scene must be selected. Should turn the arrow cursor into a cross cursor. When the magnifying icons in the toolbar are active, you can use the mouse wheel to zoom in and out of the scene.
The zooming state can be interrupted by pressing [space] or invoking any other viewing control (through [r] or [p]).
Rotation of viewing angle
- With the mouse
Main click on the scene (but not on an object) while keeping the control key pressed. You can rotate the point of view by moving the mouse till you release the button.
- With the keyboard
Invoked through pressing [r]. The cursor should turn into a circling arrow. In this state, moving the mouse while keeping the main button pressed will change the point of view of the scene.
This state can be interrupted by pressing [space] or invoking any other viewing control, through [-] , [+] or [p].
Pan action / Shift
The pan action drags the scene by pinning a point with the cursor and shifting it.
- With the mouse
Main click on the scene (but not on an object) while keeping the shift key pressed. You can drag the full viewing scene by moving the mouse till you release the mouse button.
- With the keyboard
[p] activates the panning tool. When active, the cursor arrow appears as a hand symbol.
Boxes
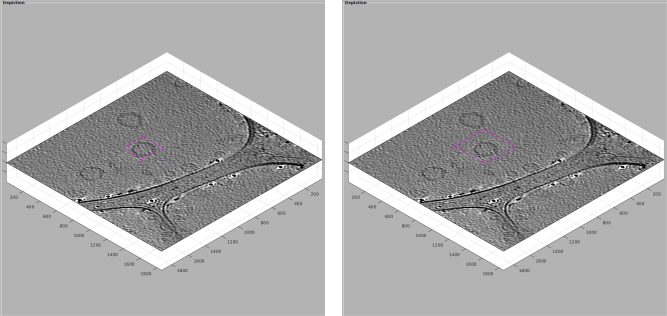
You can create boxes in the scene with the box tool in the toolbar or simply by clicking on [v]. The boxes in the scene define regions that can be used for different tasks, most commonly:
- to redefine the axis limits (i.e., the part of the scene that is shown),
- to generate projection of variable size.
Change of limits
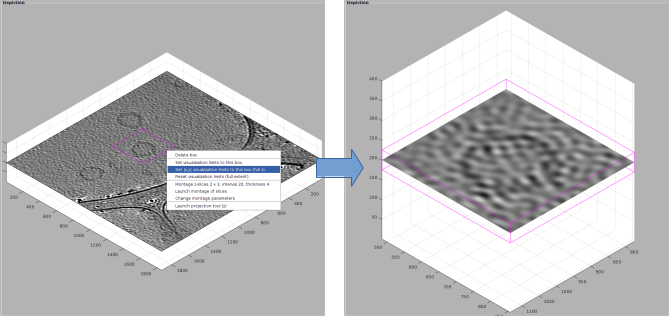
Secondary click on a box triggers a menu of options. With the first ones you can change the axis to the extent of the box in x and y (for the full z or just for the z extent of the box). Note that this is just a change of axis viewing, and the main slice will be defined for the full tomogram.
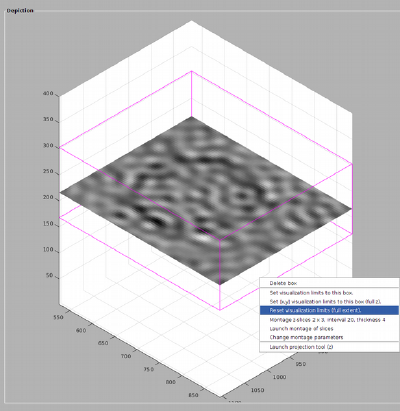
To regain the full view on the scene, you can click on the full axis icon in the toolbar, or secondary click on the box to get the option for full scene view.
Projection tool
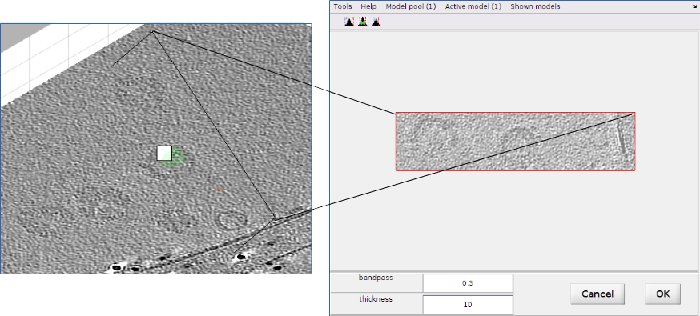
The projection tool opens a new window representing the projection along z of the fraction of tomogram currently contained in the box. This projection will refresh automatically when you move the box.
Oblique views
The main tool for visualizing and annotating on oblique slices are the interactive rotation frames. They create a frame with a system of coordinates that can be dragged and rotated with the mouse, showing the cut slice as an auxiliary image that is also interactive, allowing the creation of models or the navegation in the tomogram.
Models
Models are annotations adapted to different geometries. dynamo_tomoslice works with a model pool of models that are currently on memory. In order to edit or view models that are stored in disk inside a catalogue, the models need to be first brought to the current model pool (i.e. memory). Also, after edition of a model, it needs to be saved back into the catalogue, if the change is meant to be permanent (i.e., stored in disk).
Model management
Models currently in memory (i.e., in the model pool) can be edited. Only the model that is currently active in the window can be edited. To make model active, you can secondary click on any of its elements, and then select the option of making it active.
Creating new models
A new model can be created from scratch with the menu option [Model pool] > [Create new model in pool]. This will create a model of the same class (i.e., vesicle, membrane) as the last model registered in the pool.
Alternatively you can use [Model pool] > [Create new model in pool (select type)] if you need to create a model of a different type.
Importing models from catalogue
Saving models into the catalogue
From the command line, you can always apply the 'saveInCatalogue' method onto your model.
m.saveInCatalogue.
This assumes that your model is already assigned to a volume inside a catalogue.
Editing models
Adding points into a model
The key [c] adds a point to the currently active model.
Adding a center point into a model
The key combination shift+[c] adds a center point into the currently active model, if the model accepts a center property (like is the case for vesicles and surfaces).
Deleting points
The key [delete] will delete the last point inside a model (it can be used repeatedly to delete all points in the model in reversed creation order). To delete other points, secondary click on it and use the delete point option in the menu.
Custom plots
One can use the scene in tomoslice to display any object from the command line. Matlab and Dynamo plotting commands can be directed to any graphic container, as long as one has a handle to the container.
The handle to tomoslice can be read simply by:
h = dpkslicer.getAxes();
Once h is defined, you can plot on it with any regular command. For instance, the Matlab plot3 command:
plot3(x,y,z,'o','Parent',h);
assuming x, y and z are vector variables with the same number of entries.
Models
Models have native methods for depicting different representations: plotPoints, plotBoxes, plotDipoles, plotMesh . The syntax in all of them requires as first argument the handles to the graphic axis.
Thus, if you want to plot inside the current dtmslice session the surface of a vesicle, you just need to create the vesicle:
v = dmodels.vesicle();
v.radius = 30;
v.center = [400,200,120];
and then direct the plotSurface method to the handle h of the graphic scene of tomoslice:
v.plotSurface(h);
However, bear in mind, that the graphic entity that you depicted is treated merely as a graphic object: even if it stems from a model, its presence in the scene has not effect in the model pool.
